South Atlantic Water Science Center - North Carolina Office
|
Project OverviewFull Title Location Project Chief Period of Project Team Members Science Topic: USGS IN YOUR STATEUSGS Water Science Centers are located in each state. 
|
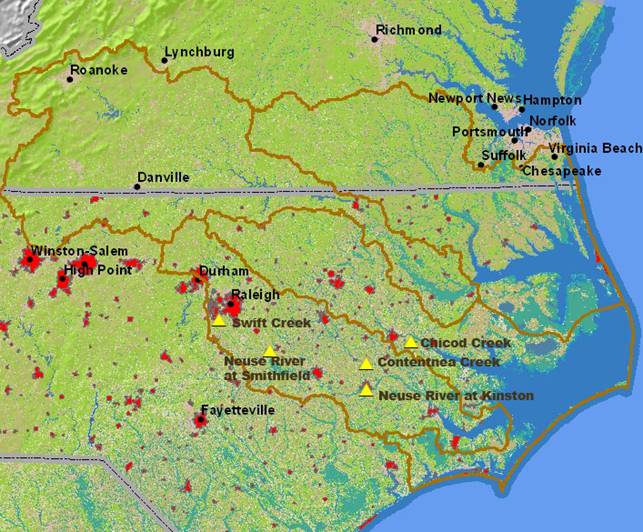
Albemarle-Pamlico NAWQA1 - Surface-water trends station water-quality and ecological samplingThe surface water status and trends sampling network includes two agricultural streams (Chicod and Contentnea Creeks), an urban stream (Swift Creek near Apex), and a large-river integrator site (Neuse River at Kinston). These are long-term stations to show trends in water quality over time (decades). Surface-water sites in the ALBE NAWQA study unit.
Neuse River at Kinston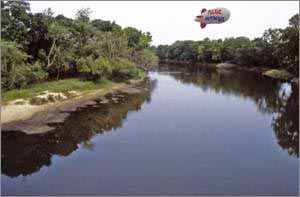
Neuse River at Kinston at low flow with ALBE blimp. 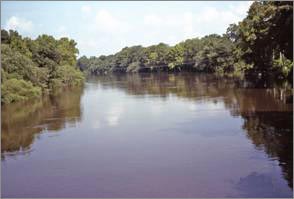
Neuse River at Kinston at high flow. Station Number: 02089500 The Neuse is a 6,977 square-kilometer basin that includes much of the Raleigh urban area in the headwaters, with extensive agriculture in the middle and lower sections of the basin. In the past 20 years the Neuse has been the focus of considerable public concern over issues of nutrient enrichment and sediment concentrations, which has resulted in legislated basin-wide nutrient limitations for municipalities and new development. The Neuse was included in the MRB2 trend analysis and SPARROW modeling effort. We have a good-long-term record at Kinston. Nitrogen concentrations are moderate. Phosphorus concentrations are high. There is periodic bacterial contamination. Atrazine, carbaryl, diuron, methlyazinphos, metolachlor, simazine, and triclopyr have been detected at levels above 0.1 ug/L. Sediment concentrations are moderate. Recent trend analysis has shown dramatic reductions in nutrient concentrations in the last decade. Chemical sampling is conducted annually at the Neuse River. Anions, nutrients, suspended sediment, and pesticide sampling alternate between twice monthly (November, January, March, May, July, and September), and once monthly (October, December, February, April, June, August). Contentnea Creek at Hookerton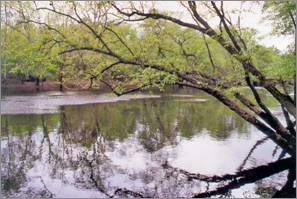
Contentnea Creek from boat launch. 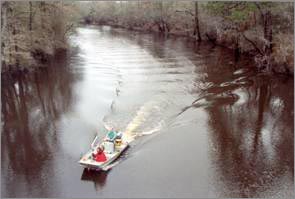
Contentnea Creek downstream from bridge. Station Number: 02091500 (rotate4) Contentnea Creek is a 1900 square-kilometer tributary basin to the Neuse River that is 42 percent agricultural land use including corn, soybeans, cotton, and hogs. This station was included in the MRB2 trend analysis and SPARROW modeling effort. We have a good-long-term record at Contentnea Creek. Nitrogen and phosphorus concentrations are high. Bacterial levels are moderate. 2, 4-D, atrazine, bromacil, carbaryl, metolachlor, prometon, and simazine have been detected at levels above 0.1 ug/L. Sediment concentrations are moderate to high. Chemical sampling has been conducted every fourth year at Contentnea Creek since FY 2008. Anions, nutrients, suspended sediment, and pesticides are sampled twice monthly at this site. Ecological sampling (fish, invertebrates, and algae) are conducted in alternate years starting from FY 2008. Swift Creek near Apex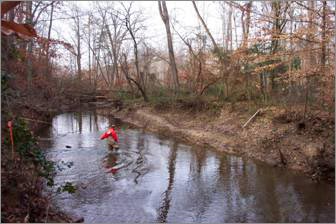
Swift Creek reach survey. 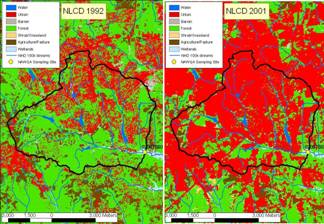
Urban growth around Swift C: 1992 to 2001 (Falcone and others, 2007). Station Number: 02087580 The 54 square-kilometer urban and suburban basin in the Raleigh metropolitan area has shown extensive urban growth in the last 20 years. New development in the basin must conform to a comparatively strict set of local management rules designed to control sediment and nutrient inputs into the basin. The basin contains many small ponds built by developers to enhance real estate sales, which also serve as sediment traps, and receiving bodies for upstream contaminants. Swift Creek has a good-long-term record. Nutrient concentrations are moderate to low. 2, 4-D, bentazon, carbaryl, diazinon, dieldrin, MCPA, pronamide, simazine, and triclopyr have been detected at levels above 0.1 ug/L, and at concentrations higher than the other sites. Sediment concentrations are high. This station is included in the MRB2 trend analysis and SPARROW modeling effort, and is a EUSE site. 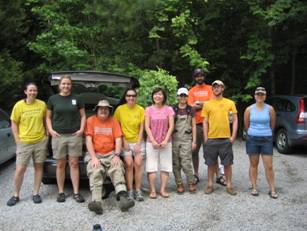
Duke and NCSU volunteers with Tom Cuffney at 2008 Swift Creek ecological sampling. Chemical sampling is conducted every other year at Swift Creek starting in FY 2007. Anions, nutrients, suspended sediment, and pesticides are sampled twice each month. Ecological sampling (fish, invertebrates, and algae) are conducted in alternate years starting from August-September 2007. Chicod Creek near Simpson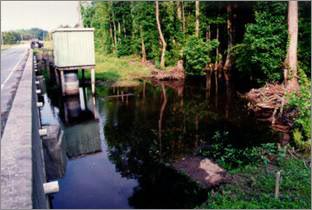
Chicod Creek gage upstream from bridge. 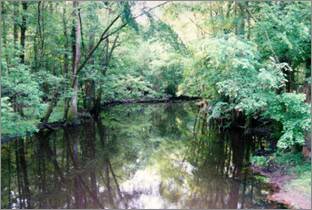
Chicod Creek downstream from bridge crossing. Station Number: 020841600 Land use in the 116 square kilometer Chicod Creek basin in the outer Coastal Plain of eastern North Carolina is primarily agriculture and forest. Although an intensive sampling site during the first cycle of NAWQA, it was discontinued in 1997. Water quality data collected from 1975 to1997 (N=207) shows a relatively high median total nitrogen concentration of 2.5 mg/L, and high median total phosphorus concentration of 0.36 mg/L. Atrazine, carbaryl, metolachlor, metribuzin, prometon, simazine and tebuthiuron have been detected at levels above 0.1 ug/L. Chemical sampling is conducted every fourth year at Chicod starting in 2010. No ecological sampling is conducted at Chicod Creek. |

![]() U.S. Department of the Interior |
U.S. Geological Survey
U.S. Department of the Interior |
U.S. Geological Survey
URL: https://nc.water.usgs.gov/projects/albe/SW.html
Page Contact Information:
North Carolina Web Development Team
Page Last Modified: Monday, 05-Dec-2016 11:19:07 EST