South Atlantic Water Science Center - North Carolina Office
|
Project OverviewFull Title Location Partner Agencies Project Chief Period of Project Team Members Science Topic USGS IN YOUR STATEUSGS Water Science Centers are located in each state. 
|
Water quality characterization of bridge deck runoff in NCThis project was completed in 2012. These pages are for historical purposes only. Approach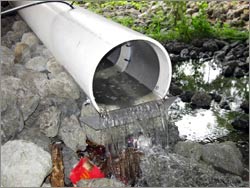 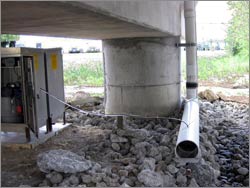
Bridge deck runoff monitoring station at US74 bridge over Smith Creek near Wilmington, New Hanover County, North Carolina Approach The specific tasks to meet the study objectives are as follows:
Task 1. Quantify bridge deck runoff volume and quality Bridge deck runoff volume and water quality and will be monitored at 15 bridge sites in North Carolina (five in the Blue Ridge, seven in the Piedmont, and three in the Coastal Plain; table 2). Runoff samples will be collected by using an automated sampler, flow will be measured continuously in the collection system discharge pipe by using acoustic velocimetry, and a raingage will be installed at each site. All pertinent bridge characteristics will be provided to USGS by NCDOT from the NCDOT bridge maintenance database. NCDOT also will provide continuous daily traffic counts at each of the 15 sites during the study. Basins upstream from the bridge sampling site will be characterized by compiling information on physical features (area, slope, etc.), population, land use, point sources, and upstream bridge crossings. Bridge Deck Runoff Constituents A broad range of constituent groups will be measured in the bridge deck runoff (table 1). These constituents were measured in at least 20 percent of the 218 highway runoff studies summarized in the National Highway Runoff Data and Methodology Synthesis (Granato, 2003) and include physical properties, solids, nutrients, major elements, trace metals, and PAHs. The number of analytes may be reduced if initial analyses consistently show concentrations that are below the laboratory reporting level. Total bridge deck stormwater loads will be based on total recoverable constituents because 1) there are fewer sample processing steps and therefore fewer opportunities for contamination, 2) North Carolina water quality criteria currently are based on total recoverable concentrations, and 3) most historical data are for total recoverable concentrations. All chemical analyses of water samples will be conducted at the USGS National Water Quality Laboratory (NWQL) in Denver, Colorado, with the exception of suspended sediment concentrations, which will be determined at the USGS Kentucky Sediment Laboratory.
Task 2. Quantify constituent concentrations and loads upstream from bridges Constituent concentrations represent conditions to which aquatic organisms are exposed. Prevailing water-quality standards also are expressed as concentrations. Therefore, comparison of constituent concentrations in bridge runoff and receiving waters is warranted. In addition, an evaluation of how much the mass of material washed off the bridge deck adds to the instream load is a measure of the relative effect of the bridge on downstream stream water quality. To make this comparison, measured bridge deck constituent loads of suspended sediment, nitrogen, phosphorus, total organic carbon, total dissolved solids, sodium, chloride, and other commonly detected constituents will be compared to instream loads at selected sites. Four bridge deck monitoring sites that are co-located with USGS stream gages (table 5) will be sampled monthly for one year to characterize instream concentrations and flux. The monthly samples will be supplemented with 6 high-flow events sampled at each site using automated samplers. The four sites represent a gradient of daily traffic counts: Swannanoa River (traffic count is in the 90th percentile of the 15 bridge sites), Little River (75 percentile), Mountain Creek (35th percentile), and Black River (5th percentile). A new, temporary streamflow gage was installed at the Swannanoa River site; USGS gages already exist at the remaining three sites. Task 3. Compare streambed sediment quality upstream and downstream from bridges Concentrations of material attached to sediment particles represent water-quality conditions on a time scale from weeks to years, depending on recent hydraulics at the site, whereas a single water sample represents water quality on a time scale from minutes to hours. Bed sediments provide habitat for aquatic organisms and an interface for ground-water and surface-water interactions; thus, they are an important component of stream ecosystems. Streambed-quality data will aid in the interpretation of benthic macroinvertebrate communities at sites near bridges, which are being assessed separately from this study. Many constituents associated with road runoff preferentially adsorb to particulates, and thus are found in higher concentrations in sediment than in overlying water. These hydrophobic constituents may include several trace metals, nutrients, and persistent organic compounds such as polycyclic aromatic hydrocarbons (PAHs). Streambed Sediment Constituents Fine-grained sediments will be analyzed for major and trace elements, total and organic carbon, total nitrogen, phosphorus, and sulfur, and semivolatile organic compounds including PAHs and pthalates (table 2). Both total-digestion and total recoverable concentrations of inorganic elements will be measured. As mentioned previously, total-digestion concentrations reflect the underlying mineralogy of the sediment, while total recoverable concentrations reflect metals that are adsorbed or lightly bound to the mineral matrix. Sediment quality guidelines are variously based on total-digestion or total-recoverable concentrations.
|
||||||||||||||||||||||||||||||||

![]() U.S. Department of the Interior |
U.S. Geological Survey
U.S. Department of the Interior |
U.S. Geological Survey
URL: https://nc.water.usgs.gov/projects/bridge_runoff/approach.html
Page Contact Information:
North Carolina Web Development Team
Page Last Modified: Monday, 05-Dec-2016 11:04:03 EST
