South Atlantic Water Science Center - North Carolina Office
|
Project OverviewFull Title Location Cooperating Agencies Project Chief Period of Project USGS IN YOUR STATEUSGS Water Science Centers are located in each state. 
|
Hydraulic Modeling of Bridges in North CarolinaThis project was completed in 2010. These pages are for historical purposes only. Project SummaryThree-dimensional rendering of the Tar River bathymetry and computation mesh through the U.S. Highway 13 bridge near Greenville, North Carolina, overlain with a simulated two-dimensional velocity field output from the Finite Element Surface-Water Modeling System (FESWMS). Background The North Carolina Department of Transportation (NCDOT) Hydraulics Unit is responsible for providing designs for bridges, culverts, and other drainage control features while adhering to permit requirements that help maintain wetlands, habitat, and water quality. The Unit also is responsible for providing field data and hydraulic design recommendations to the Bridge Maintenance Unit for its ongoing bridge-replacement program. In order to provide hydraulic design recommendations for the construction of new bridges and/or embankments, the NCDOT relies on the application of numerical models to simulate bridge hydraulics. The Hydraulics Unit almost exclusively uses one-dimensional (1-D) step-backwater models such as HEC-RAS, HEC-2 and WSPRO to simulate the hydraulics for bridge design regardless of the site conditions. Many bridges, however have site-specific characteristics that produce lateral and/or vertical variability in the velocity distribution that cannot be accurately represented with a 1-D step-backwater model. Site characteristics, such as upstream channel alignment (meanders), geomorphic setting of the river valley, flood-plain alignment relative to the channel, and hydraulic structures (levees, dikes, etc.) can produce hydraulic complexities at a bridge that cannot be simulated adequately by a 1-D model. For example, channel alignment can present a unique, site-specific problem at bridges because approaching flow distributions at flood stages can be significantly altered when flows leave a channel and enter a flood plain at a channel bend. When channel bends occur just upstream from a bridge, concentrated channel flows can be directed to a section of a bridge opening that would not typically experience this magnitude of flow if the channel were straight. Under these conditions, the flow fields are inherently two-dimensional (2-D) and cannot be accurately represented with a 1-D model. The ability to accurately simulate velocity magnitudes and distributions at bridge crossings is essential in assuring that bridge plans balance public safety with the most cost-effective design. Objectives The objectives of the initial phase of the study were to: Green Street bridge over the Tar River
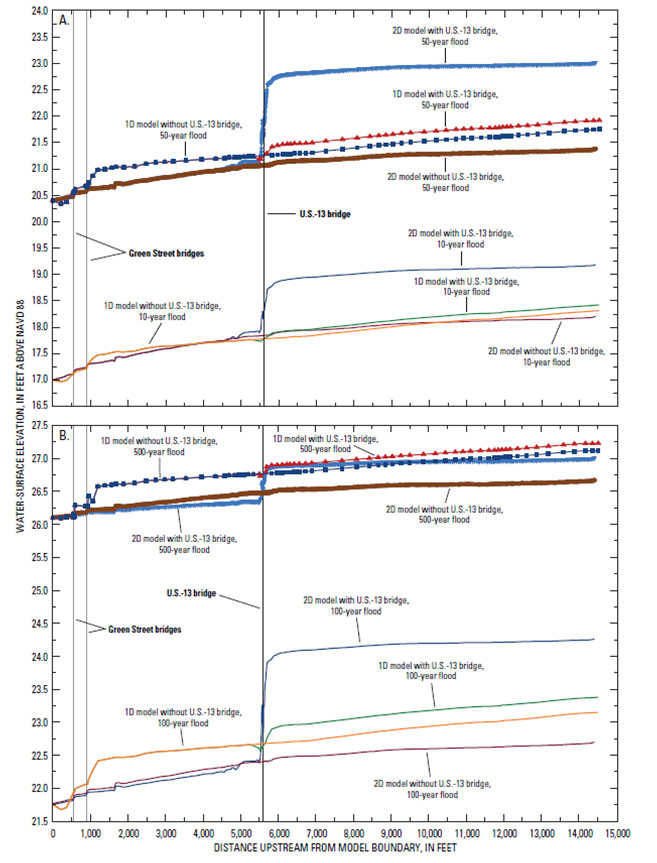
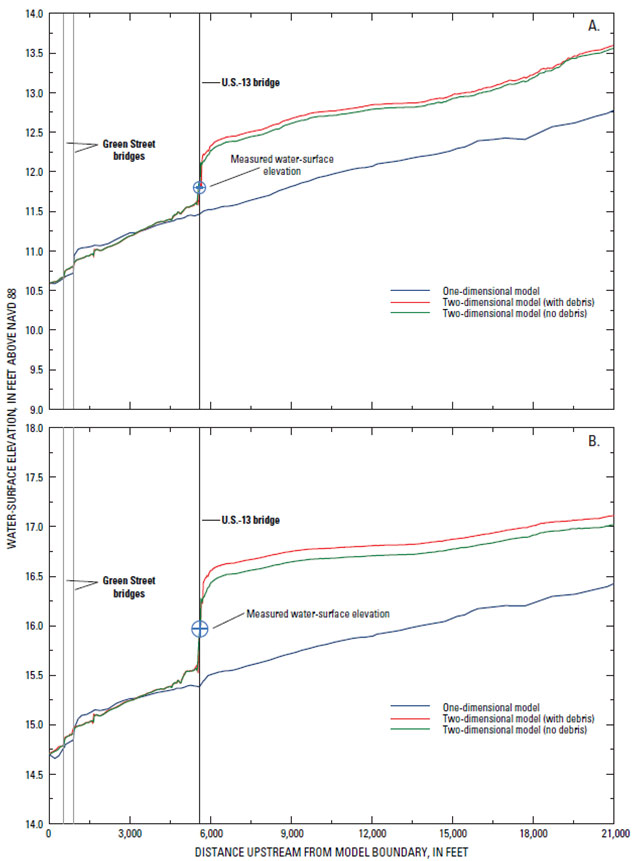
Approach The U.S. Geological Survey (USGS) first provided a multiday workshop on 2-D modeling at bridges for selected NCDOT staff members. The workshop will include information on the techniques, procedures, and data required for 2-D modeling. The main component of the study was the development and comparison of the 1-D and 2-D models. For the first phase of the ongoing study, these models were developed for the Hwy-13 bridge over the Tar River, a complex riverine bridge site selected by the NCDOT and USGS. The criterion for selecting this and future bridge sites is to target locations with historical flood data (channel profile, discharge, velocity distribution, and stage), which could supplement or be used in lieu of new field data should high-flow conditions (flow in the overbanks) not occur during the study period. Channel bathymetry data was collected at the study site and merged with digital elevation data on the flood plains to develop the topographic data set. Data were collected during two high-flow hydrographic surveys in the study reach for which discharge, cross-section velocity profiles, and water-surface elevations were collected concurrently. The hydrographic survey data were used to calibrate and validate the models. A comparison of the output of the 1-D and 2-D models relative to the field data was the basis for evaluating the differences between the two models at complex riverine and tidal bridges and the implications of these differences. The model comparison also provided valuable information in the development of guidelines for applying 2-D models at NCDOT bridge sites. Results One- and two-dimensional models of the hydraulically complex US-13 bridge over the Tar River near Greenville, North Carolina, were developed, and detailed water-surface elevations, discharge, and velocity distributions were collected in the field for two high-flow events - Hurricane Charley in August 2004 and Tropical Storm Alberto in June 2006. Comparisons of the field data relative to the results of the one- and two-dimensional models provided the basis for evaluating the differences between the two models as well as the implications of these differences. Water-surface profiles, velocity magnitudes and distributions, and scour estimates from the one- and two dimensional models were compared. The water-surface elevations for both models generally agreed downstream from the US-13 bridge; however, appreciable disparity occurred between the one-dimensional and two-dimensional models upstream from the US-13 bridge (figures 1 and 2). The disparity upstream of the US-13 bridge can mainly be attributed to differences in momentum loss at US-13. The simulated water surface slopes for the two models are similar upstream of US-13, however the two-dimensional model simulates more energy loss through the US-13 main channel bridge, US-13 overflow bridges and channel bend directly upstream of US-13. The flow conditions directly upstream and through US-13 are two-dimensional in nature, and the associated energy losses are not fully represented by a one-dimensional model, which explains the large discrepancies in simulating the water-surface elevations. Based on a comparison of measured stage at USGS streamgaging station 02083893 (located approximately 1 mile upstream from the upstream model boundary), and simulated water-surface elevations extrapolated upstream to the gage location, the two-dimensional model more accurately simulated the water-surface elevations in the study reach.
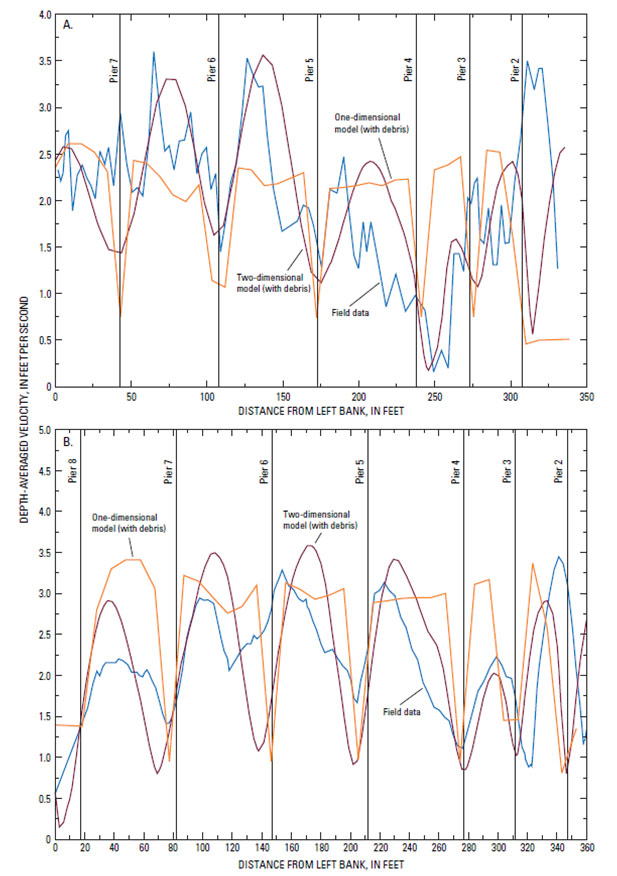
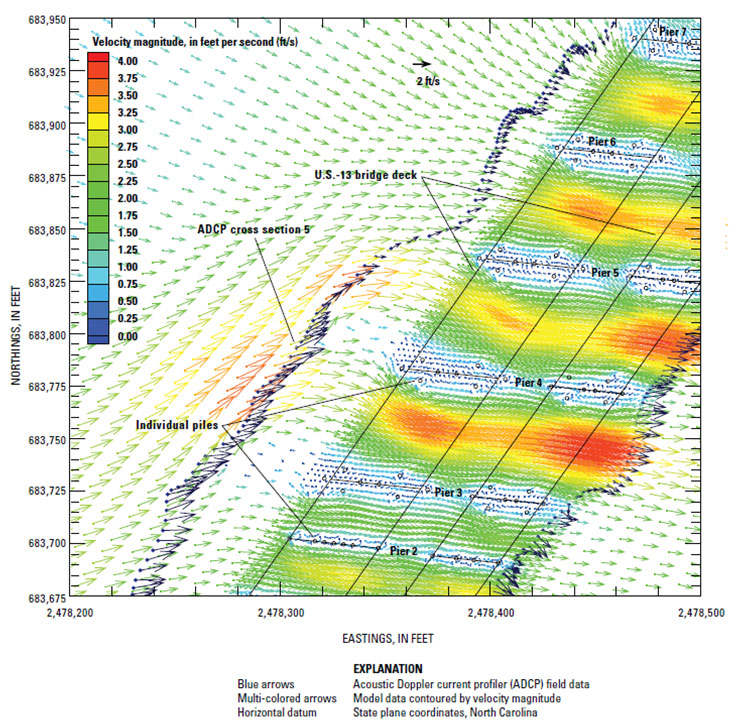
Comparisons of the modeled and measured velocity distributions through the US-13 bridge opening revealed that the one-dimensional model results are less representative, relative to the two-dimensional model, of the measured velocity magnitudes and distributions (fig. 3). In general, the velocities from the one-dimensional model are biased low and are more uniformly distributed than the velocities from the two-dimensional model and measured data. The two-dimensional model most accurately simulates the contracted-flow magnitudes and direction (figs. 4, 5) through the bridge opening, which makes it a better tool for safe and efficient bridge design. Large floating debris rafts between piers 2 and 5 were observed during both high-flow hydrographic surveys. The general location of the debris accumulation was consistent in both high-flow surveys, although the extent and quantity of debris were different. Uncertainty, therefore, is associated with modeling hypothetical scenarios and(or) conditions that have not been surveyed because of the natural variability in debris supply and configuration at various flows, which can greatly affect the simulated flow fields through a bridge. The NCDOT current (2007) designation of debris potential at bridges is high, moderate, or low based on field observations and interviews with bridge maintenance personnel. The results of this study indicate that the potential for debris accumulation is moderate to high at the U.S.-13 bridge, which appreciably affects the velocity magnitudes and distribution through the bridge.
Little or no information is available during the planning and design stages of a new bridge regarding the hydraulics of the river until a predictive model is developed and applied. Hydrologic, topographic, and physiographic characteristics of the area around the bridge site can be useful in determining whether a one- or two-dimensional model is needed to accurately estimate the hydraulic conditions. By compiling pertinent site characteristics and relating them to the results of several model-comparison studies, the framework for developing guidelines for selecting the most appropriate model for a given bridge site can be accomplished. Potentially relevant bridge-site characteristics for the development of modeling guidelines are defined in table 1, including a summary of the characteristics of the US-13 bridge over the Tar River near Greenville. Table 1. Definitions of potentially relevant bridge-site characteristics for the development of modeling guidelines at bridges, including site characteristics for the US-13 bridge over the Tar River near Greenville, North Carolina.
The results of this study indicate that for bridges having skews of 60 degrees, 7 piers in the main channel, debris potential that is more than 3 times the pier widths and a meander bend directly upstream, a two dimensional model provides a more accurate representation of water-surface elevations and velocity magnitudes and directions through the bridge. Combined information from several similar projects and incorporating comparisons of existing models from other DOTs in the Southeastern Region can provide North Carolina DOT engineers and staff with the tools and data that are essential in improving bridge design and mitigating structural hazards at a range of hydraulically complex sites. |
||||||||||||

![]() U.S. Department of the Interior |
U.S. Geological Survey
U.S. Department of the Interior |
U.S. Geological Survey
URL: https://nc.water.usgs.gov/projects/ncdot_model/overview.html
Page Contact Information:
North Carolina Web Development Team
Page Last Modified: Monday, 05-Dec-2016 11:04:46 EST
