USGS - science for a changing world

South Atlantic Water Science Center - North Carolina Office

South Atlantic WSC Home Data Projects Publications Drought Floods Media About Us Contact [an error occurred while processing this directive]   Internal

USGS gaged location

ABOUT THE NC WATER OFFICE

USGS IN YOUR STATE

USGS Water Science Centers are located in each state.

There is a USGS Water Science Center office in each State. Washington Oregon California Idaho Nevada Montana Wyoming Utah Colorado Arizona New Mexico North Dakota South Dakota Nebraska Kansas Oklahoma Texas Minnesota Iowa Missouri Arkansas Louisiana Wisconsin Illinois Mississippi Michigan Indiana Ohio Kentucky Tennessee Alabama Pennsylvania West Virginia Georgia Florida Caribbean Alaska Hawaii New York Vermont New Hampshire Maine Massachusetts South Carolina North Carolina Rhode Island Virginia Connecticut New Jersey Maryland-Delaware-D.C.

Surface Water Levels
Rocky River near Norwood (Site SW8)
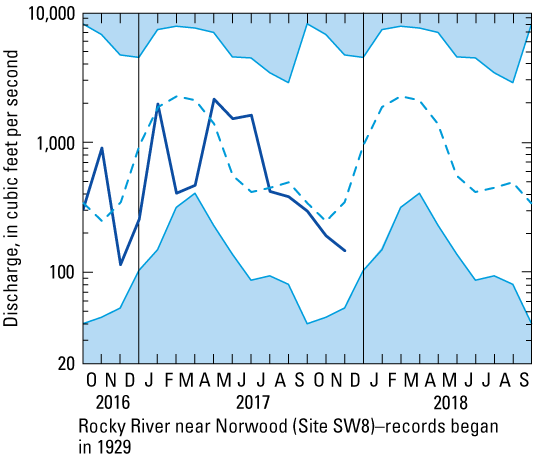

Hydrograph

Monthly mean flow for November 2017 is 150 cfs

Explanation

Unshaded area indicates range between highest and lowest record for the month.

Dashed line indicates median monthly mean streamflow.

Heavy line indicates monthend levels for current period.

This data is provisional and is subject to revision.


USGS Home Water Climate Change Core Science Ecosystems Energy and Minerals Env. Health Hazards

Accessibility FOIA Privacy Policies and Notices

Take Pride in America logo USA.gov logo U.S. Department of the Interior | U.S. Geological Survey
URL: https://nc.water.usgs.gov/monthly/November17/siteSW8.html
Page Contact Information: North Carolina Web Development Team
Page Last Modified: Wednesday, 06-Dec-2017 12:00:04 EST