|
ABOUT THE NC WATER OFFICE
USGS IN YOUR STATE
USGS Water Science Centers are located in each state.
|
December 2017
Compiled by J. Curtis Weaver
In cooperation with the North Carolina Department of Environment and Natural Resources, National Weather Service, and other State, Local, and Federal agencies.
U.S. Geological Survey · 3916 Sunset Ridge Road · Raleigh, North Carolina 27607 · (919) 571-4000
Rainfall
Data provided by the National Weather Service
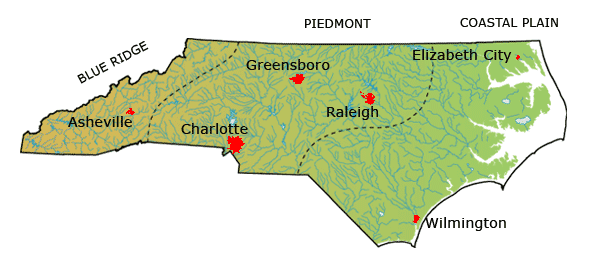
Click on a city name to view rainfall graphs.
Water-level Hydrographs
Click on a site number or name to view hydrographs.
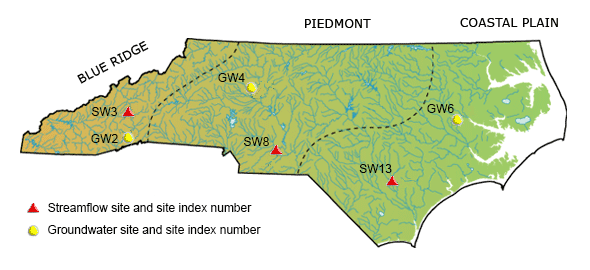
- Streamflow gaging stations
 French Broad River at Asheville, NC (SW3)
 Rocky River near Norwood, NC (SW8)
 Black River near Tomahawk, NC (SW13)
- Groundwater wells
 Blantyre well (GW2)
 Mocksville well (GW4)
 Simpson well (GW6)
Streamflow Conditions
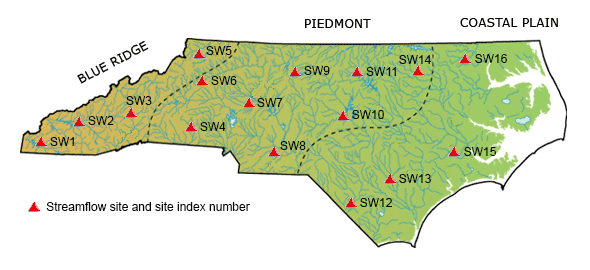
December 2017 streamflow conditions
|
|
[mi2, square mile; ft3/s, cubic foot per second; in, inch; a, above (streamflow in the upper 75th percentile); b, below (streamflow in the lower 25th percentile); n, normal (streamflow between the 25th and 75th percentiles); *, Record high monthly mean discharge for December] |
| Station name and site index number |
Drainage area (mi2) |
Monthly mean flow (ft3/s) |
Percent of long-term median |
a,b,n |
Runoff (in.) |
Monthly mean flow last month (ft3/s) |
Maximum daily flow |
Minimum daily flow |
Additional Data |
| ft3/s |
Date |
ft3/s |
Date |
| Valley River at Tomotla (site SW1) |
104 |
163 |
69 |
n |
1.81 |
123 |
396 |
12/24 |
82.4 |
12/4 |
NWISWeb |
| Oconaluftee River at Birdtown (site SW2) |
184 |
425 |
80 |
n |
2.66 |
411 |
983 |
12/24 |
234 |
12/4 |
NWISWeb |
| French Broad River at Asheville (site SW3) |
945 |
1412 |
71 |
n |
1.72 |
1896 |
2560 |
12/21 |
1180 |
12/17, 18 |
NWISWeb |
| First Broad River near Casar (site SW4) |
60.5 |
33.3 |
43 |
b |
0.63 |
38.7 |
44.3 |
12/21 |
28.0 |
12/4 |
NWISWeb |
| South Fork New River near Jefferson (site SW5) |
205 |
310 |
80 |
n |
1.74 |
482 |
388 |
12/24 |
267 |
12/16 |
NWISWeb |
| Elk Creek at Elkville (site SW6) |
50.9 |
56.0 |
63 |
n |
1.27 |
85.4 |
64.0 |
12/24 |
51.9 |
12/31 |
NWISWeb |
| South Yadkin River near Mocksville (site SW7) |
306 |
163 |
55 |
b |
0.61 |
169 |
235 |
12/21 |
139 |
12/4 |
NWISWeb |
| Rocky River near Norwood (site SW8) |
1,372 |
238 |
25 |
b |
0.20 |
150 |
740 |
12/10 |
129 |
12/4 |
NWISWeb |
| Reedy Fork near Oak Ridge (site SW9) |
20.6 |
8.51 |
43 |
b |
0.48 |
6.91 |
13.5 |
12/9 |
6.99 |
12/28 |
NWISWeb |
| Deep River at Moncure (site SW10) |
1,434 |
141 |
13 |
b |
0.11 |
77.1 |
304 |
12/12 |
86.5 |
12/2 |
NWISWeb |
| Flat River at Bahama (site SW11) |
149 |
9.17 |
8 |
b |
0.07 |
3.53 |
45.6 |
12/10 |
2.01 |
12/1 |
NWISWeb |
| Lumber River at Boardman (site SW12) |
1,228 |
687 |
65 |
b |
0.64 |
283 |
994 |
12/21 |
238 |
12/6 |
NWISWeb |
| Black River near Tomahawk (site SW13) |
676 |
474 |
80 |
n |
0.81 |
169 |
1050 |
12/13 |
136 |
12/1, 2 |
NWISWeb |
| Little Fishing Creek near White Oak (site SW14) |
177 |
52.6 |
37 |
b |
0.34 |
29.4 |
305 |
12/10 |
19.2 |
12/5 |
NWISWeb |
| Trent River near Trenton (site SW15) |
168 |
96.6 |
73 |
n |
0.66 |
40.9 |
253 |
12/12 |
44.6 |
12/1 |
NWISWeb |
| Potecasi Creek near Union (site SW16) |
225 |
121 |
93 |
n |
0.62 |
54.0 |
404 |
12/10 |
30.1 |
12/5 |
NWISWeb |
Period of Record Maximum Mean Monthly Discharge for December
"e" is Estimated Monthly Mean Discharge -or- Estimated Daily Value
*Record high December monthly discharge for period of record.
Groundwater Levels
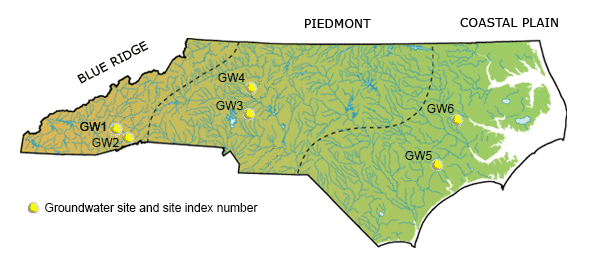
| December 2017 groundwater levels |
|
[a, above (water level in the upper 75th percentile); b, below (water level in the lower 25th percentile); n, normal (water level between the 25th and 75th percentiles); p, based on partial record for the month] |
| Station name and site index number |
Monthly mean level (feet) |
Monthly mean level last month (feet) |
a,b,n |
Low daily level |
High daily level |
Additional Data |
| Feet |
Date |
Feet |
Date |
| Camp Hope, NC-40 (GW1) |
5.36 |
5.24 |
b |
5.44 |
12/31 |
5.26 |
12/21, 22 |
NWISWeb
|
| Blantrye, NC-144 (GW2) |
30.82 |
31.48 |
n |
30.94 |
12/25 |
30.68 |
12/12 |
NWISWeb |
| Piedmont RS 1, NC-193 (GW3) |
7.31 |
7.28 |
n |
7.40 |
12/4, 31 |
7.16 |
12/12, 21 |
NWISWeb
|
| Mocksville, NC-142 (GW4) |
19.37 |
19.25 |
n |
19.41 |
12/4, 16, 17, 18, 19, 20 |
19.30 |
12/12, 23, 24 |
NWISWeb
|
| Comfort, NC-173 (GW5) |
6.42 |
7.66 |
n |
8.34 |
12/4 |
4.85 |
12/30 |
NWISWeb |
| Simpson, NC-160 / PI-532 (GW6) |
3.21 |
2.57 |
n |
4.06 |
12/4 |
2.30 |
12/9 |
NWISWeb |
Period of record minimum monthly water level (for indicated month).
* Monthly water levels not determined due to missing record during the month (equipment problems).
The data presented herein are provisional and are subject to revision as new data becomes available.
|
