|
Project Overview
Full Title
Rating Unsaturated Zone and Watershed Characteristics of Public Water Supplies - 2009 Updates
Location
 Statewide Statewide
Cooperating Agencies
Public Water Supply Section
Source Water Assessment and Protection Program
Project Chief
Silvia Terziotti
seterzio@usgs.gov
Period of Project
1/2009 - 6/2009
Team Members
Kirsten Tighe
Ramona Traynor
USGS IN YOUR STATE
USGS Water Science Centers are located in each state.
|
Rating Unsaturated Zone and Watershed Characteristics of Public Water Supplies - 2009 Updates
This project was completed in 2009. These pages are for historical purposes only.
Methods
Methods developed for the initial project and published in the report, "Methods of rating unsaturated zone and watershed characteristics of public water supplies in North Carolina" (Eimers and all, 2000), were followed as closely as possible for updates to key GIS layers. Changes to the methods were necessary in some cases because of new data formats or differences in source datasets.
Unsaturated Zone Layers
Vertical Series Hydraulic Conductance
The vertical series hydraulic conductance (also referred to as conductance) layer is calculated for the entire thickness of the unsaturated zone. The entire thickness of the unsaturated zone includes a soil layer, and may include a saprolite and crystalline bedrock layer depending on the depth to water at any point. To calculate the conductance value, thickness of soils, depth to bedrock and soil conductance are necessary. The conductance of the saprolite and bedrock layers are also needed.
County-level soil information from the Natural Resources Conservation Service (NRCS) Soil Survey Geographic Database (SSURGO) database for North Carolina was used where available. The SSURGO data provide an estimate for conductance of the soil layer, thickness of the soil layer, and depth to the bedrock of a soil layer. This was combined with the depth to water layer, and the conductance values for saprolite and bedrock that were created for the 2000 compilation of conductance.
Detailed soils were available for 73 counties in the 2000 release of the data. For the update of the conductance layer, twenty additional detailed soil surveys became available since the initial project and were used to calculate the conductance of the soil layer statewide.
Newly released SSURGO data for 20 counties (Anson, Avery, Buncombe, Burke, Catawba, Chatham, Clay, Cleveland, Graham, Henderson, Lee, Lincoln, Madison, Montgomery, Stokes, Surry, Transylvania, Vance, Watauga, Yadkin) and a new version of Haywood County were included in this update. The counties of Caswell, Cherokee, Iredell, Rowan, Rutherford, Swain, and Warren were not available at the time of processing. The less detailed State Soil Geographic (STATSGO) database was used in these counties to compute conductance values.
In 2004, NRCS implemented a new database and access system to the SSURGO spatial and tabular data. Because of this, methods developed in 2000 for the original compilation of unsaturated zone data were modified. The fields from the SSURGO soils database used in 2000 were no longer available. Permeability of soil fields, PERML and PERMH, have been replaced by Ksat in the SSURGO database. The SSURGO Metadata table column descriptions define Ksat as “the amount of water that would move vertically through a unit area of saturated soil in unit time under unit hydraulic gradient.” (http://soils.usda.gov/survey/geography/ssurgo/). Verbal communication with Soil Scientists at NRCS confirmed that the Ksat variable should be used as a substitute for perml and permh (Roy Vick, April 30, 2009). The NRCS also distributes software to calculate one Ksat value per soil type, as a weighted average over the soil layers. This value for each soil is multiplied by .1417 to convert it to an inch per hour ratio, comparable to the values used in 2000.
Soil thickness and depth to bedrock were also updated from the SSURGO data for the 21 counties that were updated. New conductance values were calculated separately for the new county data, and merged with the 2000 layer.
One additional change was made from the 2000 compilation. The categories were rescaled to better represent the conductance through a smaller area represented by a 30 by 30 meter cell size. The new categories and ratings for Vertical series hydraulic conductance are:
Table 1 -- Vertical series hydraulic conductance categories and rating values for unsaturated zone rating
| Vertical series hydraulic conductance categories (feet-squared
per day) |
Percent of area in North Carolina |
Rating |
| ≤ 50 |
33 |
1 |
| > 50 to ≤ 100 |
14 |
2 |
| > 100 to ≤ 200 |
9 |
3 |
| > 200 to ≤ 400 |
11 |
4 |
| > 400 to ≤ 800 |
8 |
5 |
| >800 to ≤ 1,600 |
3 |
6 |
| >1,600 to ≤ 3,200 |
3 |
7 |
| >3,200 to ≤ 6,400 |
5 |
8 |
| >6,400 to ≤ 12,800 |
2 |
9 |
| >12,800 |
12 |
10 |
The following figures show the counties that were updated, a detailed view of
the change in conductance values in an updated area, and the statewide
conductance classes.
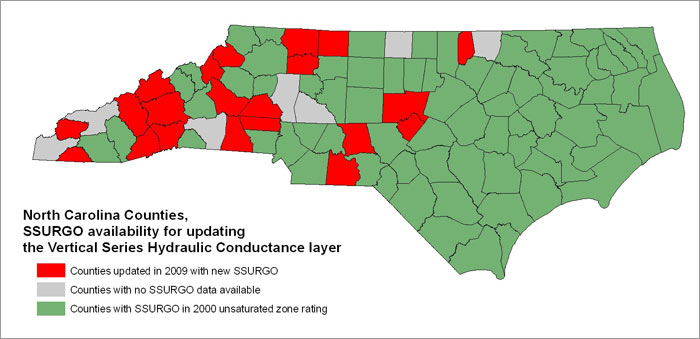
Figure 1 -- North Carolina counties with detailed soils data.
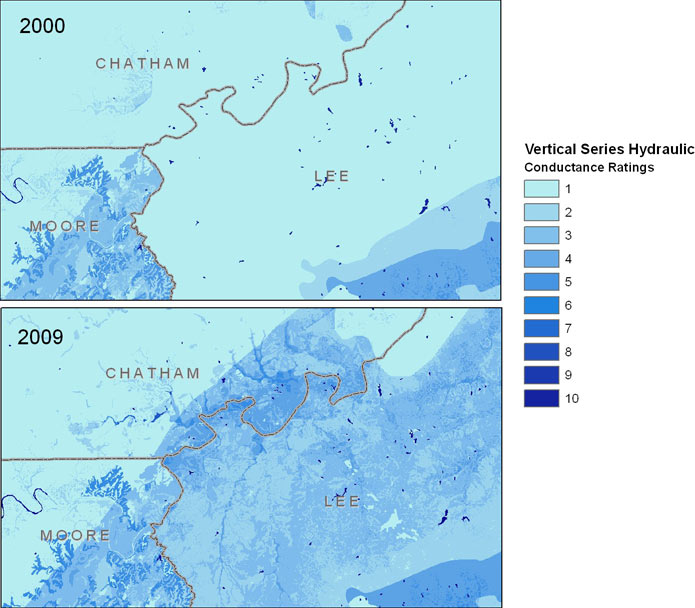
Figure 2 -- A comparison of Vertical series hydraulic conductance ratings, 2000
to 2009.
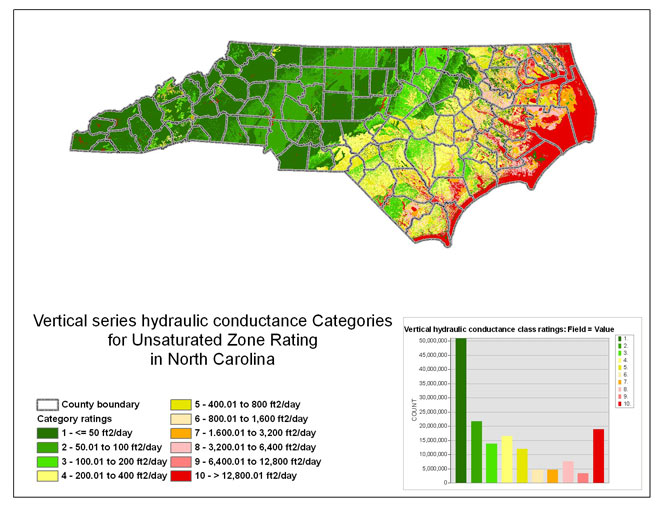
Figure 3 -- The vertical series hydraulic conductance category
ratings for the unsaturated zone rating.
Land-Surface Slope
Since the initial compilation of land-surface slope classes in 2000, a new source
of elevation data has become available. In 2001, the State of North Carolina,
Floodplain Mapping Program began to produce a digital elevation model (DEM)
from lidar data to produce digital flood maps. LiDAR is an airborne laser sensor used to collect elevation data at a very high degree
of accuracy (20 cm vertical accuracy). The slopes derived from a lidar DEM tend to capture areas of
high slope that occur over short distances, such as ridges on stream banks,
that earlier mapping techniques were not able to record. This tends to increase
slope values over a study area. Figure 4 illustrates changes in slope in a
small area, from the original elevation source and the 2009 elevation source.
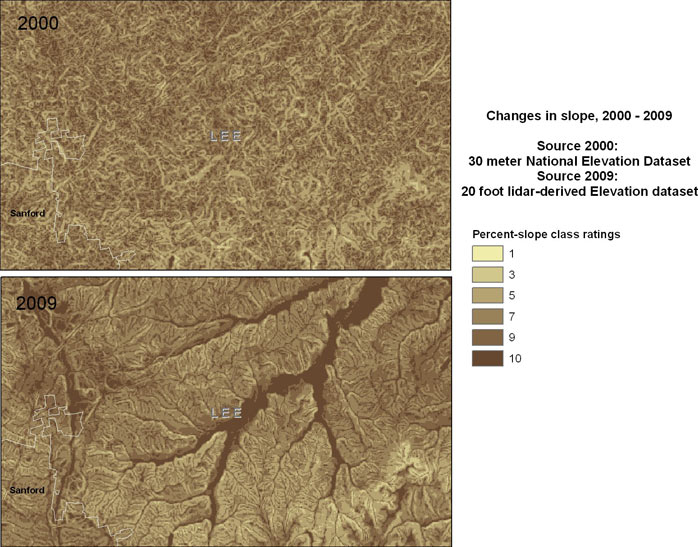
Figure 4 -- A comparison percent-slope ratings, 2000 to 2009.
The slope dataset was created from the individual tiles of elevation
with 20-foot horizontal post spacing. The data are freely downloadable at the North Carolina
Floodplain Mapping Information System site (http://ncfloodmaps.com). The
elevation tiles were merged to encompass the entire State of North Carolina,
projected from a North Carolina state-plane coordinate system in feet, to
a North Carolina state-plane coordinate system in meters, and resampled to
a 30-meter cell size. The elevation values were also recalculated from feet
to meters so that the horizontal and vertical units were the same. A 10-meter elevation dataset was used from the USGS National Elevation Dataset (NED) to fill in areas of surrounding States that were necessary to complete river basin areas. The slope values were calculated using ArcGIS slope function and were classified into the following classes:
Table 2 -- Land-surface slope categories and ratings for unsaturated zone rating.
| Land-surface slope, in percent unit rise/run unit |
Percent of area in NC |
Rating |
| > 50 percent |
3 |
1 |
| > 20 percent to ≤ 50 percent |
10 |
3 |
| > 10 percent to ≤ 20 percent |
10 |
5 |
| > 5 percent to ≤ 10 percent |
16 |
7 |
| > 2 percent to ≤ 5 percent |
17 |
9 |
| ≤ 2 percent |
43 |
10 |
The following figure shows the updated slope classes and ratings for
North Carolina.
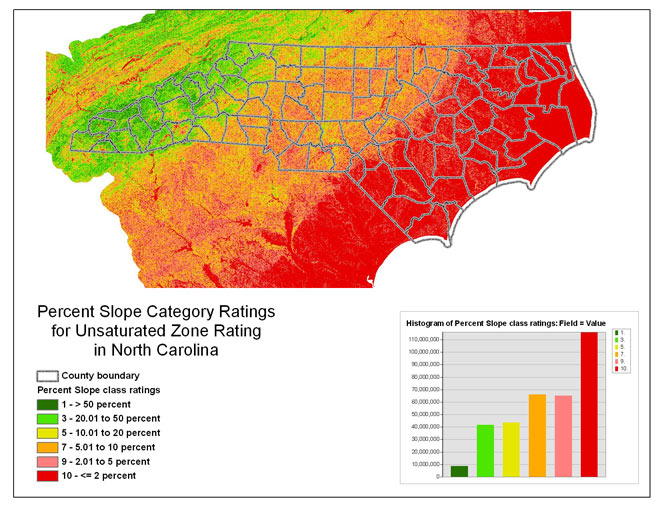
Figure 5 -- The percent-slope category ratings for the unsaturated zone
rating.
Land cover
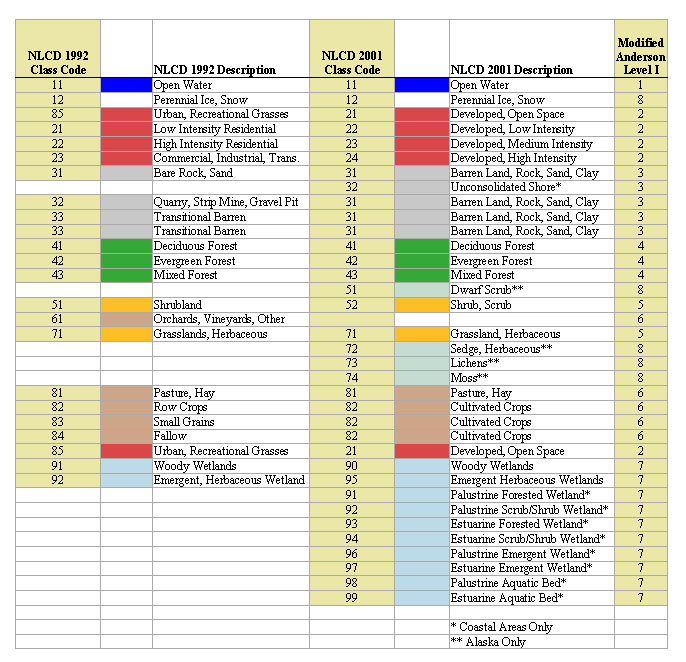
The source of land cover is the National Land Cover Dataset (NLCD) 2001
land cover product. The Multi-Resolution Land Characteristics (MRLC)
data used in 1999 were an early version of the NLCD 1992 data product.
The 2001 data were released over a multi-year period, beginning in about
2004 for North Carolina. Slight changes were made to the land cover classes
for the NLCD 2001 data. The USGS has published a cross-walk to allow
users of the 1992 data to match categories in the 2001 data. The following
table is provided from the NLCD 1992-2001 Retrofit Change Product website
(http://www.mrlc.gov/changeproduct.php).
NLCD 1992-2001 Anderson Level I Cross-walk Table.
A great deal of care was taken when assigning values to the land cover
classes in the original project. A team of experts was used to come
up with assigned ratings for each land cover class. The scope of this
update effort did not allow the time to reassemble a team of outside
experts to assign values to new classes in the land cover data set. An
internal review team of specialists were assembled at the USGS to review
the land cover classes and assign rating values to the new classes. The
team was comprised of USGS, N.C. Water Science Center employees including
the N.C. Water Quality Specialist, N.C. Surface Water Specialist, N.C.
Groundwater Specialist, Albermarle-Pamlico Basin National Water-Quality
Assessment Study Unit Chief, Hydrologic Investigations Section Chief,
and the N.C. Geographic Information Systems Specialist. Team members
reviewed the definitions of new classes and reviewed the cross-walk from
the 1992 to 2001 data set to assign final ratings to all classes of the
2001 NLCD land cover data for the unsaturated zone, watershed characteristics
and land use.
Table 3 -- Land cover classes and ratings for the unsaturated
zone. (Rows with red text are new land cover classes, orange
text indicates a change to the land cover class or NLCD code.)
| NLCD code |
Class |
Class Description |
Percent area in NC |
Land Cover UZ Rating |
| 24 |
Developed, High Intensity |
24. Developed, High Intensity - Includes highly developed areas where
people reside or work in high numbers. Examples include apartment complexes,
row houses and commercial/industrial. Impervious surfaces account for 80
to100 percent of the total cover. |
< 1 |
1 |
| 11 |
Open Water |
11. Open Water - All areas of open water, generally with less than 25%
cover of vegetation or soil. |
1 |
2 |
| 90 |
Woody Wetlands |
90. Woody Wetlands - Areas where forest or shrubland vegetation accounts
for greater than 20 percent of vegetative cover and the soil or substrate
is periodically saturated with or covered with water. |
11 |
2 |
| 95 |
Emergent Herbaceous Wetlands |
95. Emergent Herbaceous Wetlands - Areas where perennial herbaceous vegetation
accounts for greater than 80 percent of vegetative cover and the soil or
substrate is periodically saturated with or covered with water. |
1 |
2 |
| 23 |
Developed, Medium Intensity |
23. Developed, Medium Intensity - Includes areas with a mixture of constructed
materials and vegetation. Impervious surfaces account for 50-79 percent
of the total cover. These areas most commonly include single-family housing
units. |
1 |
2 |
| 22 |
Developed, Low Intensity |
22. Developed, Low Intensity - Includes areas with
a mixture of constructed materials and vegetation. Impervious surfaces
account for 20-49 percent of total cover. These areas most commonly include
single-family housing units. |
2 |
4 |
| 31 |
Barren Land (Rock/Sand/Clay) |
31. Barren Land (Rock/Sand/Clay) - Barren areas of
bedrock, desert pavement, scarps, talus, slides, volcanic material, glacial
debris, sand dunes, strip mines, gravel pits and other accumulations of
earthen material. Generally, vegetation accounts for less than 15% of total
cover. |
< 1 |
6 |
| 82 |
Cultivated Crops |
82. Cultivated Crops - Areas used for the production of annual crops,
such as corn, soybeans, vegetables, tobacco, and cotton, and also perennial
woody crops such as orchards and vineyards. Crop vegetation accounts for
greater than 20 percent of total vegetation. This class also includes all
land being actively tilled. |
11 |
6 |
| 71 |
Grassland/ Herbaceous |
71. Grassland/Herbaceous - Areas dominated by grammanoid or herbaceous
vegetation, generally greater than 80% of total vegetation. These areas
are not subject to intensive management such as tilling, but can be utilized
for grazing. |
6 |
8 |
| 81 |
Pasture/Hay |
81. Pasture/Hay - Areas of grasses, legumes, or grass-legume mixtures
planted for livestock grazing or the production of seed or hay crops, typically
on a perennial cycle. Pasture/hay vegetation accounts for greater than
20 percent of total vegetation. |
12 |
8 |
| 21 |
Developed, Open Space |
21. Developed, Open Space - Includes areas with a mixture of some constructed
materials, but mostly vegetation in the form of lawn grasses. Impervious
surfaces account for less than 20 percent of total cover. These areas most
commonly include large-lot single-family housing units, parks, golf courses,
and vegetation planted in developed settings for recreation, erosion control,
or aesthetic purposes |
6 |
8 |
| 52 |
Shrub/Scrub |
52. Shrub/Scrub - Areas dominated by shrubs; less than 5 meters tall
with shrub canopy typically greater than 20% of total vegetation. This
class includes true shrubs, young trees in an early successional stage
or trees stunted from environmental conditions. |
2 |
9 |
| 41 |
Deciduous Forest |
41. Deciduous Forest - Areas dominated by trees generally greater than
5 meters tall, and greater than 20% of total vegetation cover. More than
75 percent of the tree species shed foliage simultaneously in response
to seasonal change. |
28 |
10 |
| 42 |
Evergreen Forest |
42. Evergreen Forest - Areas dominated by trees generally greater than
5 meters tall, and greater than 20% of total vegetation cover. More than
75 percent of the tree species maintain their leaves all year. Canopy is
never without green foliage. |
14 |
10 |
| 43 |
Mixed Forest |
43. Mixed Forest - Areas
dominated by trees generally greater than 5 meters tall, and greater than
20% of total vegetation cover. Neither deciduous nor evergreen species
are greater than 75 percent of total tree cover. |
3 |
10 |
The following figures show the increase in urbanization that has occurred
between 1992 and 2001 in a zoomed in area of the State, and the overall
rating distribution for land cover.
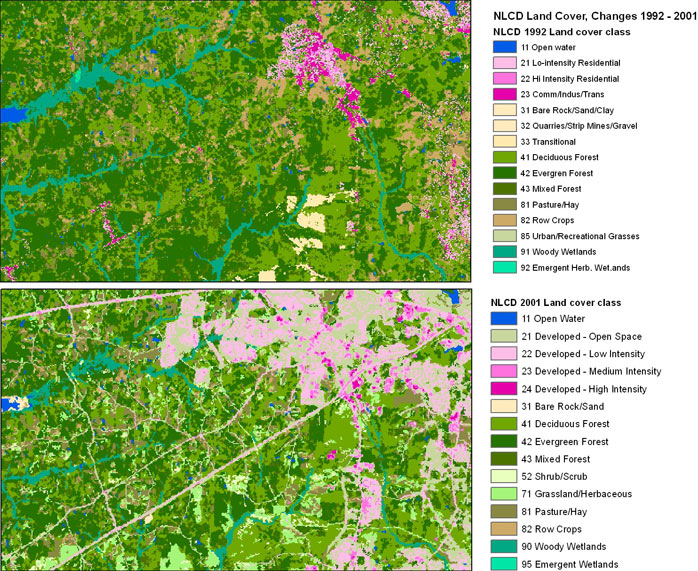
Figure 6 -- A comparison of land cover categories from sources of data
used for the 2000 unsaturated zone rating and the 2009 unsaturated zone
rating.
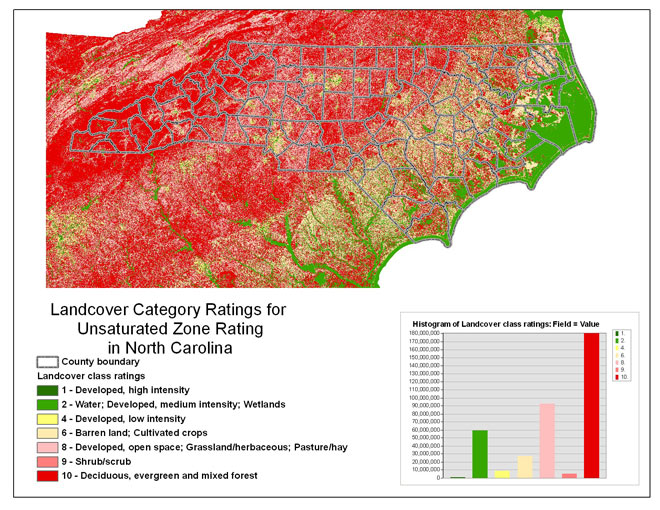
Figure 7 -- The land cover category ratings for the unsaturated zone
rating.
Land Use
The 2009 Land use rating was applied using the same update methods as
for land cover. As was the case in 2001, the identical values were used
for unsaturated zone and watershed characteristics ratings. The new values
are defined in the following table:
Table 4 -- Land use classes and ratings
for the unsaturated zone and watershed characteristics rating. (Rows
with red text are new land cover classes, orange
text indicates a change
to the land cover class or NLCD code.)
| NLCD code |
Class |
Class Description |
Percent of area in NC |
Land Use UZR and WSC Rating |
| 11 |
Open Water |
11. Open Water - All areas of open water, generally with less than 25%
cover of vegetation or soil. |
1 |
1 |
| 90 |
Woody Wetlands |
90. Woody Wetlands - Areas where forest or shrubland vegetation accounts
for greater than 20 percent of vegetative cover and the soil or substrate
is periodically saturated with or covered with water. |
11 |
1 |
| 95 |
Emergent Herbaceous Wetlands |
95. Emergent Herbaceous Wetlands - Areas where perennial herbaceous vegetation
accounts for greater than 80 percent of vegetative cover and the soil or
substrate is periodically saturated with or covered with water. |
1 |
1 |
| 31 |
Barren Land (Rock/Sand/Clay) |
31. Barren Land (Rock/Sand/Clay) - Barren areas of bedrock, desert pavement,
scarps, talus, slides, volcanic material, glacial debris, sand dunes, strip
mines, gravel pits and other accumulations of earthen material. Generally,
vegetation accounts for less than 15% of total cover. |
< 1 |
2 |
| 41 |
Deciduous Forest |
41. Deciduous Forest - Areas dominated by trees generally greater than
5 meters tall, and greater than 20% of total vegetation cover. More than
75 percent of the tree species shed foliage simultaneously in response
to seasonal change. |
28 |
3 |
| 42 |
Evergreen Forest |
42. Evergreen Forest - Areas dominated by trees generally greater than
5 meters tall, and greater than 20% of total vegetation cover. More than
75 percent of the tree species maintain their leaves all year. Canopy is
never without green foliage. |
14 |
3 |
| 43 |
Mixed Forest |
43. Mixed Forest - Areas dominated by trees generally greater than 5
meters tall, and greater than 20% of total vegetation cover. Neither deciduous
nor evergreen species are greater than 75 percent of total tree cover. |
3 |
3 |
| 52 |
Shrub/Scrub |
52. Shrub/Scrub - Areas dominated by shrubs; less than 5 meters tall
with shrub canopy typically greater than 20% of total vegetation. This
class includes true shrubs, young trees in an early successional stage
or trees stunted from environmental conditions. |
2 |
4 |
| 71 |
Grassland/ Herbaceous |
71. Grassland/Herbaceous - Areas dominated by grammanoid or herbaceous
vegetation, generally greater than 80% of total vegetation. These areas
are not subject to intensive management such as tilling, but can be utilized
for grazing. |
6 |
4 |
| 81 |
Pasture/Hay |
81. Pasture/Hay - Areas of grasses, legumes, or grass-legume mixtures
planted for livestock grazing or the production of seed or hay crops, typically
on a perennial cycle. Pasture/hay vegetation accounts for greater than
20 percent of total vegetation. |
12 |
5 |
| 21 |
Developed, Open Space |
21. Developed, Open Space - Includes areas with a mixture of some constructed
materials, but mostly vegetation in the form of lawn grasses. Impervious
surfaces account for less than 20 percent of total cover. These areas most
commonly include large-lot single-family housing units, parks, golf courses,
and vegetation planted in developed settings for recreation, erosion control,
or aesthetic purposes |
6 |
6 |
| 22 |
Developed, Low Intensity |
22. Developed, Low Intensity - Includes areas with a mixture of constructed
materials and vegetation. Impervious surfaces account for 20-49 percent
of total cover. These areas most commonly include single-family housing
units. |
2 |
7 |
| 82 |
Cultivated Crops |
82. Cultivated Crops - Areas used for the production of annual crops,
such as corn, soybeans, vegetables, tobacco, and cotton, and also perennial
woody crops such as orchards and vineyards. Crop vegetation accounts for
greater than 20 percent of total vegetation. This class also includes all
land being actively tilled. |
11 |
7 |
| 23 |
Developed, Medium Intensity |
23. Developed, Medium Intensity - Includes areas with a mixture of constructed
materials and vegetation. Impervious surfaces account for 50-79 percent
of the total cover. These areas most commonly include single-family housing
units. |
1 |
8 |
| 24 |
Developed, High Intensity |
24. Developed, High Intensity - Includes highly developed areas
where people reside or work in high numbers. Examples include apartment
complexes, row houses and commercial/industrial. Impervious surfaces account
for 80 to100 percent of the total cover. |
< 1 |
10 |
The areal extent is shown below.
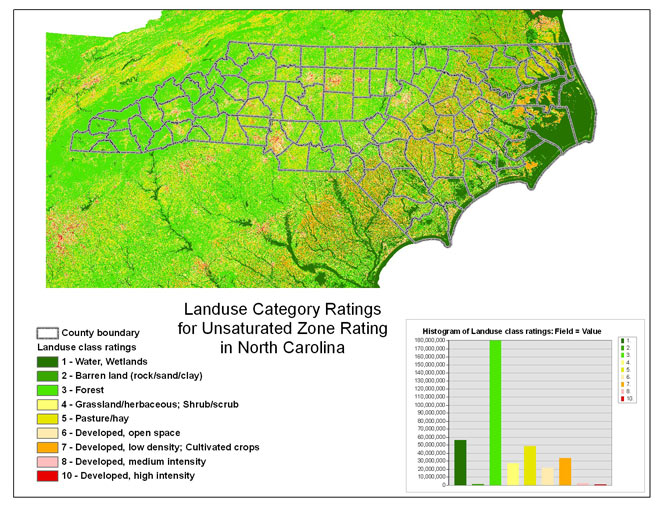
Figure 8 -- The land use category ratings for the unsaturated zone rating and watershed characteristics rating.
Unsaturated Zone Rating
As defined in the Methods paper (Eimers and all, 1999), the rating for unsaturated zone is calculated using the following weights assigned to each of the unsaturated zone factors:
Table 5 – Factors and weights that contribute to the unsaturated zone rating.
| Factor |
Weight |
| Vertical series hydraulic conductance |
3 |
| Land-surface slope |
2 |
| Land cover |
2 |
| Land use |
3 |
Table 6 -- The distribution of unsaturated zone rating values categorized into 10 equal interval classes.
| Unsaturated zone rating category |
Percent of area in N.C. |
Square Miles |
| 10 - 19 |
< 1 |
7 |
| 20 - 28 |
< 1 |
141 |
| 29 - 37 |
4 |
2,319 |
| 38 - 46 |
25 |
13,584 |
| 47 - 55 |
29 |
15,399 |
| 56 - 64 |
25 |
13,550 |
| 65 - 73 |
9 |
5,042 |
| 74 - 82 |
4 |
2,366 |
| 83 - 91 |
1 |
258 |
| 92 - 100 |
0 |
0 |
The areal distribution of the unsaturated zone is shown in figure 9.
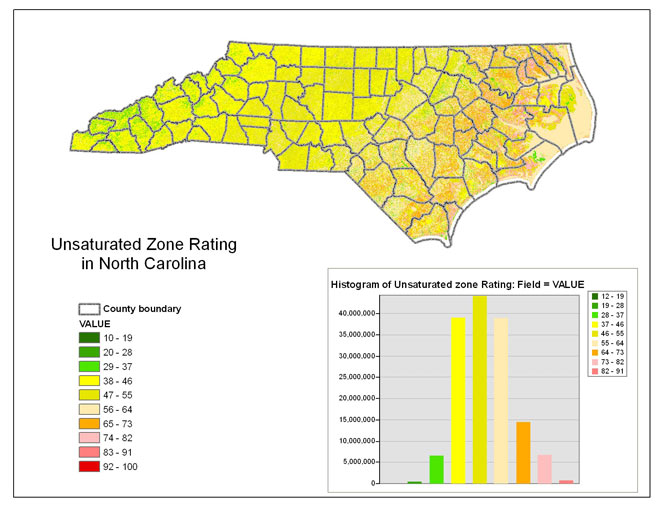
Figure 9 -- The unsaturated zone ratings for North Carolina.
Watershed Characteristics Rating
Average Annual Precipitation
The average annual precipitation was updated to reflect a more recent
period of record. The annual average precipitation rating in 2000 was
based on the years 1961 through 1990. The current data set covers the
period 1971 to 2007. This reflects changes from recent hurricanes as
well as two major droughts that occurred in N.C. during 1998-2002 and
again in 2008 (McSwain, K.B., and Weaver, J.C., 2008, Effects of the
current drought on streamflow and groundwater conditions in North Carolina:
Charlotte, NC, Geological Society of America Southeastern Section Meeting
[abs].; and Weaver, J.C., 2005, The drought of 1998-2002 in North Carolina—Precipitation and hydrologic conditions: U.S. Geological Survey Scientific Investigations Report 2005-5053, 88 p.) There was an increase in tropical storm and hurricane activity that affected North Carolina during this period. According to the State Climate Office of North Carolina, 38 tropical storms or hurricanes affected North Carolina during the period 1971 to 2007. There were only 19 during the period 1961 to 1990 (http://www.nc-climate.ncsu.edu/climate/hurricane.php).
The following table shows the average annual precipitation classes and ratings:
Table 7 -- The average annual precipitation category rating within North Carolina.
| Average annual precipitation, in inches |
Percent of area in North Carolina |
Rating |
| ≤ 40 inches |
1 |
1 |
| >40 to 45 inches |
39 |
2 |
| >45 to 50 inches |
32 |
3 |
| >50 to 55 inches |
19 |
4 |
| >55 to 60 inches |
7 |
5 |
| >60 to 65 inches |
1 |
6 |
| >65 to 70 inches |
1 |
7 |
| >70 to 75 inches |
<1 |
8 |
| >75 to 80 inches |
<1 |
9 |
| >80 inches |
1 |
10 |
The following figure shows the average annual precipitation ratings within
North Carolina:
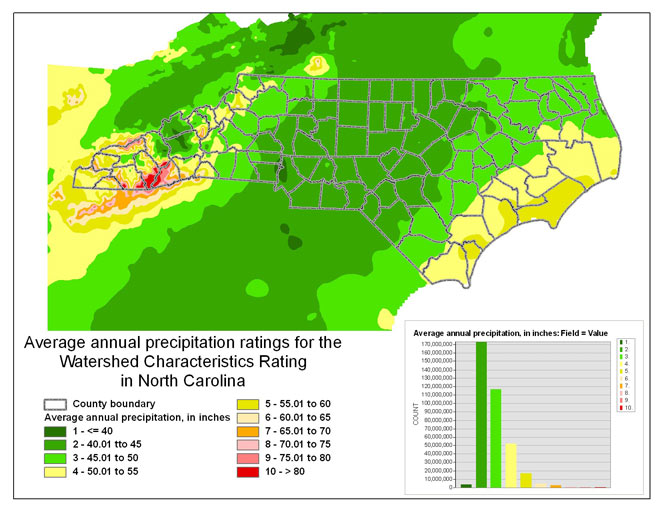
Figure 10 -- The average annual precipitation ratings for North Carolina.
Land-surface Slope
The percent slope layer described for the unsaturated zone rating are
the same as for the watershed characteristics rating. The same slope layer
was used, but different classes were created to which ratings were applied.
The following table describes the ratings and classes for the watershed
characteristics rating:
Table 8 -- The land-surface slope category ratings
within North Carolina.
| Land-surface slope, in percent unit rise/run unit |
Percent of area in NC |
Rating |
| ≤ 2 percent |
43 |
1 |
| > 2 percent to ≤ 5 percent |
17 |
3 |
| > 5 percent to ≤ 10 percent |
16 |
5 |
| > 10 percent to ≤ 20 percent |
10 |
7 |
| > 20 percent to ≤ 50 percent |
10 |
9 |
| > 50 percent |
3 |
10 |
The figure below illustrates the slope ratings for the watershed characteristics
rating for N.C.
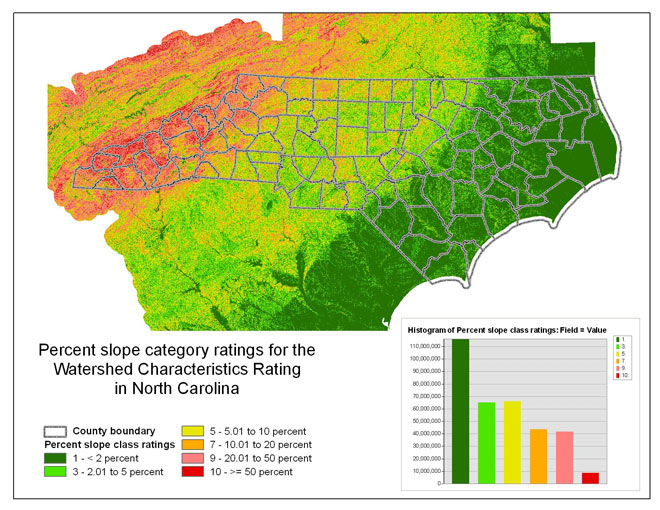
Figure 11 -- The land-surface slope ratings for the watershed characteristics
rating for North Carolina.
Land cover
Land cover classes were determined in the same manner as for unsaturated
zone. The following table summarizes the land cover categories and ratings
for the watershed characteristics rating:
Table 9 -- Land cover classes
and ratings for the watershed characteristics rating. (Rows with red
text are new land cover classes, orange
text indicates a change to the
land cover class or NLCD code.)
| NLCD code |
Class |
Class Description |
Percent of area in NC |
Land Cover WSC Rating |
| 41 |
Deciduous Forest |
41. Deciduous Forest - Areas dominated by trees generally greater than
5 meters tall, and greater than 20% of total vegetation cover. More than
75 percent of the tree species shed foliage simultaneously in response
to seasonal change. |
28 |
1 |
| 42 |
Evergreen Forest |
42. Evergreen Forest - Areas dominated by trees generally greater than
5 meters tall, and greater than 20% of total vegetation cover. More than
75 percent of the tree species maintain their leaves all year. Canopy is
never without green foliage. |
14 |
1 |
| 43 |
Mixed Forest |
43. Mixed Forest - Areas dominated by trees generally greater than 5
meters tall, and greater than 20% of total vegetation cover. Neither deciduous
nor evergreen species are greater than 75 percent of total tree cover. |
3 |
1 |
| 52 |
Shrub/Scrub |
52. Shrub/Scrub - Areas dominated by shrubs; less than 5 meters tall
with shrub canopy typically greater than 20% of total vegetation. This
class includes true shrubs, young trees in an early successional stage
or trees stunted from environmental conditions. |
2 |
2 |
| 11 |
Open Water |
11. Open Water - All areas of open water, generally with less than 25%
cover of vegetation or soil. |
1 |
3 |
| 90 |
Woody Wetlands |
90. Woody Wetlands - Areas where forest or shrubland vegetation accounts
for greater than 20 percent of vegetative cover and the soil or substrate
is periodically saturated with or covered with water. |
11 |
3 |
| 95 |
Emergent Herbaceous Wetlands |
95. Emergent Herbaceous Wetlands - Areas where perennial herbaceous vegetation
accounts for greater than 80 percent of vegetative cover and the soil or
substrate is periodically saturated with or covered with water. |
1 |
3 |
| 71 |
Grassland/ Herbaceous |
71. Grassland/Herbaceous - Areas dominated by grammanoid or herbaceous
vegetation, generally greater than 80% of total vegetation. These areas
are not subject to intensive management such as tilling, but can be utilized
for grazing. |
6 |
3 |
| 81 |
Pasture/Hay |
81. Pasture/Hay - Areas of grasses, legumes, or grass-legume mixtures
planted for livestock grazing or the production of seed or hay crops, typically
on a perennial cycle. Pasture/hay vegetation accounts for greater than
20 percent of total vegetation. |
12 |
3 |
| 21 |
Developed, Open Space |
21. Developed, Open Space - Includes areas with a mixture of some constructed
materials, but mostly vegetation in the form of lawn grasses. Impervious
surfaces account for less than 20 percent of total cover. These areas most
commonly include large-lot single-family housing units, parks, golf courses,
and vegetation planted in developed settings for recreation, erosion control,
or aesthetic purposes |
6 |
4 |
| 31 |
Barren Land (Rock/Sand/Clay) |
31. Barren Land (Rock/Sand/Clay) - Barren areas of bedrock, desert pavement,
scarps, talus, slides, volcanic material, glacial debris, sand dunes, strip
mines, gravel pits and other accumulations of earthen material. Generally,
vegetation accounts for less than 15% of total cover. |
< 1 |
5 |
| 82 |
Cultivated Crops |
82. Cultivated Crops
- Areas used for the production of annual crops, such as corn, soybeans,
vegetables, tobacco, and cotton, and also perennial woody crops such as
orchards and vineyards. Crop vegetation accounts for greater than 20 percent
of total vegetation. This class also includes all land being actively tilled. |
11 |
6 |
| 22 |
Developed, Low Intensity |
22. Developed, Low Intensity - Includes areas with
a mixture of constructed materials and vegetation. Impervious surfaces
account for 20-49 percent of total cover. These areas most commonly include
single-family housing units. |
2 |
7 |
| 23 |
Developed, Medium Intensity |
23. Developed, Medium Intensity - Includes areas with
a mixture of constructed materials and vegetation. Impervious surfaces
account for 50-79 percent of the total cover. These areas most commonly
include single-family housing units. |
1 |
8 |
| 24 |
Developed, High Intensity |
24. Developed, High Intensity -
Includes highly developed areas where people reside or work in high numbers.
Examples include apartment complexes, row houses and commercial/industrial.
Impervious surfaces account for 80 to100 percent of the total cover. |
< 1 |
10 |
The following figure shows the areal distribution of rating classes for land cover for the watershed characteristics rating:
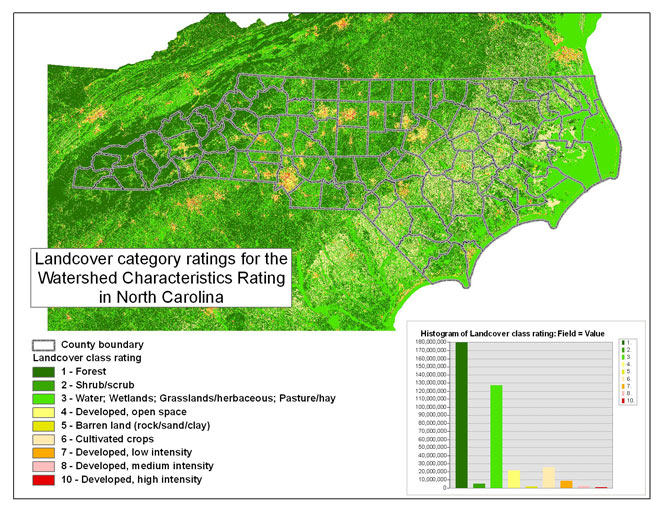
Figure 12 -- The land cover ratings for the watershed characteristics rating in North Carolina.
Land Use
Land use is processed and rated in identical ways for the unsaturated zone and watershed characteristics rating. Please see the land use category methods listed under unsaturated zone.
The following figure shows the land use class for the watershed characteristics rating.
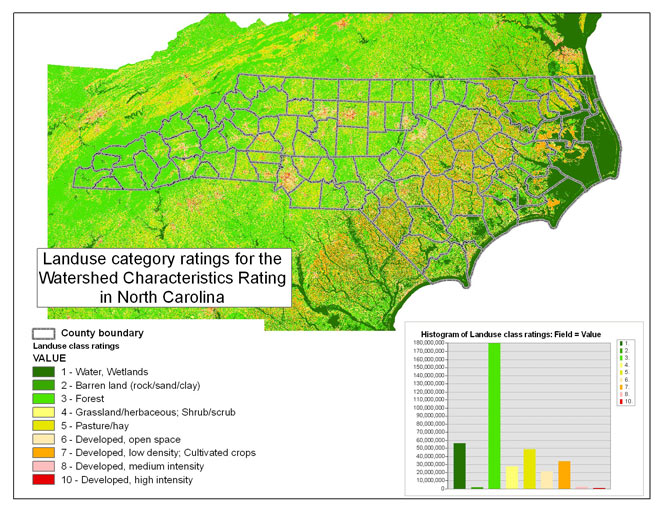
Figure 13 -- The land use category ratings for the unsaturated zone rating and watershed characteristics rating.
Groundwater Contribution
The state-wide layer was recalculated with the 2009 unsaturated zone rating values clipped to the same buffered stream network that was used in 2000 as a means of comparing the published USGS watershed characteristics rating with the updated values.
The layer is not used as part of the deliverable to Public Water Supply section because the State calculates the groundwater contribution based on precise basin delineations of public water supply watersheds. These basin delineations are not static, so the final rating is done individually for each public water-supply watershed.
Watershed Characteristics Rating
The watershed characteristics rating for North Carolina using the same factors and weights as in 2000. They are summarized in table 10.
Table 10 – Factors and weights that contribute to the watershed characteristics rating.
| Factor |
Weight |
| Average annual precipitation |
3 |
| Land-surface slope |
2 |
| Land cover |
1 |
| Land use |
3 |
| Groundwater contribution |
1 |
The distribution of rating values throughout North Carolina is shown
in table 11.
Table 11 -- The distribution of watershed characteristics
rating values categorized into 10 equal interval classes.
| Watershed Characteristics rating category |
Percent of area in N.C. |
Square Miles |
| 10 - 19 |
5 |
2,396 |
| 20 - 28 |
43 |
22,444 |
| 29 - 37 |
29 |
15,191 |
| 38 - 46 |
16 |
8,378 |
| 47 - 55 |
7 |
3,914 |
| 56 - 64 |
1 |
308 |
| 65 - 73 |
< 1 |
37 |
| 74 - 82 |
< 1 |
2 |
| 83 - 91 |
< 1 |
< 1 |
| 92 - 100 |
< 1 |
< 1 |
The areal distribution of the watershed characteristics rating is shown
in figure 14.
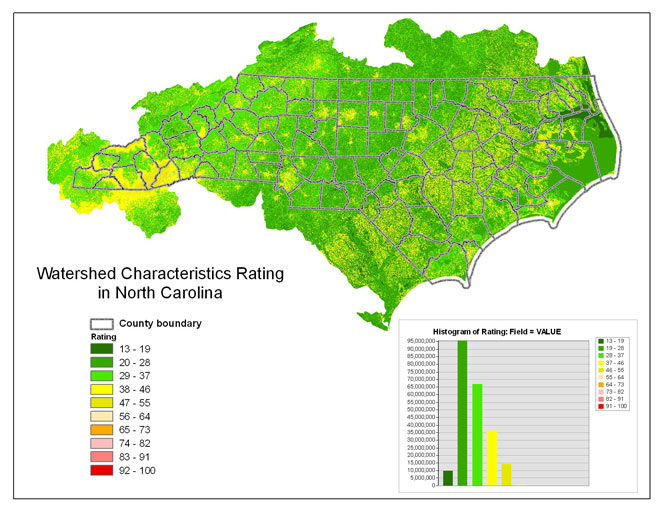
Figure 14 -- The watershed characteristics ratings for North Carolina.
An intermediate watershed characteristics rating layer is provided to the Public Water Supply Section that does not include the groundwater contribution ratings. The intermediate layer is combined with a groundwater characteristics factor for each public water-supply watershed in North Carolina for the final watershed characteristics rating.
|

