South Atlantic Water Science Center - North Carolina Office
 |
Water Resources IMPACT ArticleBy Silvia E. Terziotti, Mary J. Giorgino, and Christopher L. DrepsAmerican Water Resources Association Citation Terziotti, S.E., Giorgino, M.J., and Dreps, C.L., 2006, The Upper Neuse watershed evaluation tool—Putting the power of the NHD to work in local watersheds: Water Resources Impact, v. 8, no. 2, p. 19-24. |
In order to monitor, plan for protection, or advocate for a stream or river, people need basic information. What is the water quality of streams in the watershed? What are the watershed’s special natural resources? What are the likely sources of stress to the stream? What might be the situation in the future? Ability to access basic information in a useful format is the key to answering these crucial management questions.
Chris Dreps, Coordinator of the Upper Neuse River Basin Association
The Upper Neuse River basin is a 770-square mile basin in central North Carolina. The basin contains nine reservoirs that currently supply more than one half million people with drinking water. Population is projected to grow by 53 percent over the next 25 years (Tetra Tech, Inc., 2003), which likely will result in greater demands for drinking water and increased conversion of rural and agricultural lands to urban and suburban uses—challenges shared by other urbanizing regions across the country.
The Upper Neuse River basin is typical of other basins of similar size in that multiple local, State, and Federal agencies are responsible for managing land and water resources within its boundaries. These agencies have diverse missions, including water-quality monitoring and regulation, land-use planning, drinking-water supply, wastewater treatment, stormwater management, and conservation and environmental protection. In spite of this diversity, they share a need for detailed, spatially consistent, and readily accessible information regarding stream and watershed characteristics. However, the spatial data needed to support decisionmaking often are in various locations, at disparate scales, and of limited utility because they are not linked to a hydrologic network. Furthermore, the lack of tools for combining and evaluating spatial data hinders evaluation of management options.
The Upper Neuse Watershed Evaluation Tool (WET) is an innovative geographic information system (GIS) tool for conducting watershed analysis. This GIS tool was developed through a partnership of the U.S. Geological Survey (USGS), the North Carolina Ecosystem Enhancement Program (NCEEP), and the Upper Neuse River Basin Association (UNRBA). The NCEEP is a State agency that funds stream- and wetland- restoration activities, including the development of “local watershed plans” that identify restoration and protection strategies. The UNRBA consists of representatives from eight municipal and six county governments, and local Soil and Water Conservation Districts. Its mission is to provide a forum for cooperation in water-quality protection and water-resource planning and management.
The WET is a pilot application using the high-resolution (1:24,000 scale) National Hydrography Dataset (NHD). The WET provides powerful tools for visualizing features, delineating watershed boundaries, summarizing watershed characteristics and statistics, and creating maps; thus, automating tasks that previously required significant time and financial resources. Project partners are using the WET to develop watershed restoration plans, assess sources of pollution, support field work, develop regional monitoring strategies, and create detailed maps.
At the heart of the Upper Neuse WET is the NHD, which allows users to associate other types of spatial information with stream reaches, so that analysis can be done on these features in relation to the hydrologic network. The WET operates in ArcView 3.21, which offers affordability and compatibility with hardware and software used by the cooperating local and State governments. The datasets are compatible with other geographic information systems and can be imported easily into other applications.
A primary development goal was to make the tool useful for local and State governments. Therefore, the project sponsors and several user agencies formed a partnership to guide the development of the WET. Members of the task group determined the capabilities that would be most useful in the WET, developed priorities for incorporating ancillary data sets, and provided local data. Their input and support were key to the success of the project.
By providing partners the same information with easy-to-use analytical tools, interagency cooperation is enhanced and encouraged.
Building on the geospatial foundation provided by the NHD, the WET integrates the best available sources of data from multiple agencies. It incorporates high-resolution orthophotography and other high-resolution datasets that never before had been combined (Table 1). Links to Internet web sites are available for key layers so that real-time data or contact information can be accessed from outside sources with the click of a button (Figure 1).
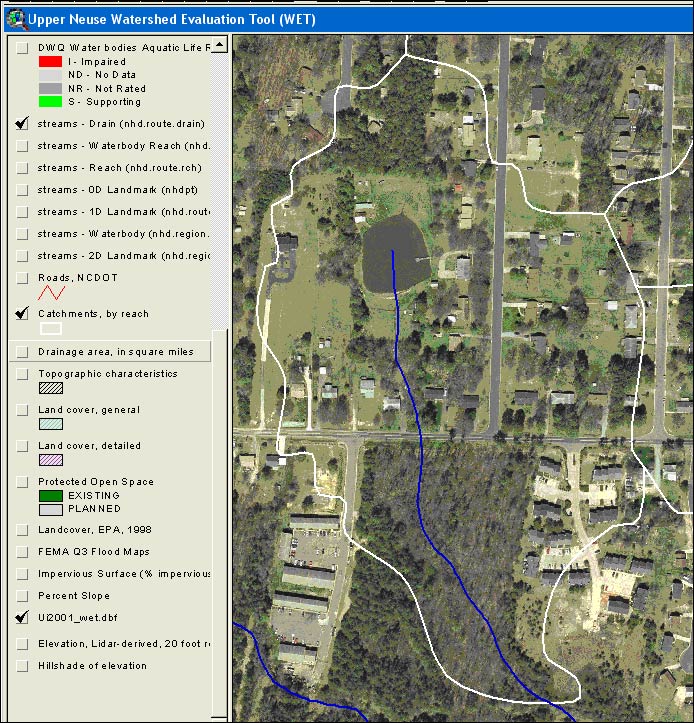
Another key feature of the WET is a new, more accurate elevation model derived from data obtained with Light Detection and Ranging (LiDAR) technology. The LiDAR-derived elevation model was used to produce a more accurate stream network that mirrors the density of the NHD but more closely matches the orthophotography and other features, such as land parcels and bridge locations. In the pilot project, the new stream segments were assigned corresponding reach codes from the NHD and can be used in the future to revise the current NHD. Drainage-area boundaries, or catchments, were created around each of the stream reaches by using the LiDAR-derived elevation data to capture detailed surface characteristics (Figure 2).
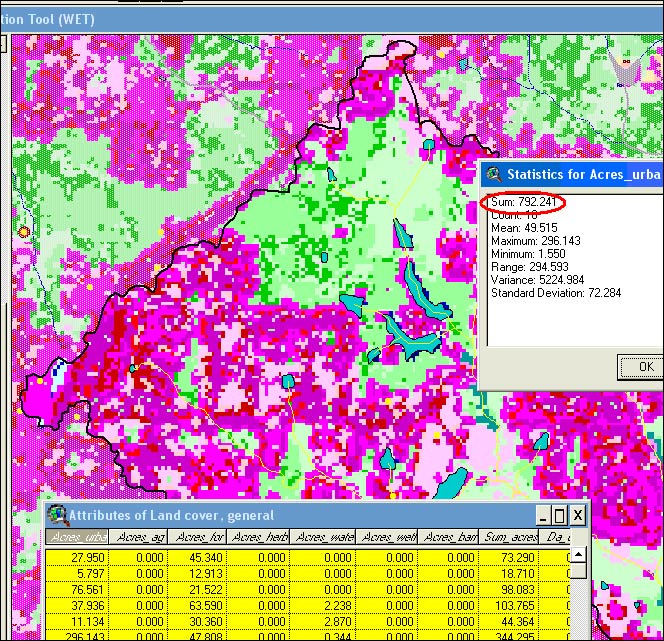
Of the 29 datasets currently available in the WET, more than half are indexed and linked to the NHD reaches or their catchments, making it easy to compile and view the data in relation to the surface-water network (Table 1). Building the WET with pre-linked data tables allows automated selection of multiple data layers to describe stream and watershed characteristics. A user can open the appropriate table after selecting a location, and the corresponding records are highlighted (Figure 3). This allows a user to easily aggregate and statistically summarize data for selected reaches and catchments (Figure 4).
The USGS conducted a hands-on training workshop and distributed DVDs with the WET, including all GIS datasets, to the project partners.
Twenty-nine data layers geo-referenced to the NHD, including datasets characterized as
Points (e.g., wastewater outfalls, water-supply intakes, monitoring sites);
Lines (e.g., roads, stream use-support ratings); and
Polygons (e.g., land cover, soils, impervious surface).
Hotlinks to important data holdings, including
Real-time water level and streamflow;
Water-quality data and contact information for monitoring sites;
NPDES discharge information; and
Potential contamination sources inventory.
Tools for producing basic statistics and summaries of data—The WET makes it easy to answer questions, such as
“How many wastewater outfalls are upstream from this water-supply intake?”
“What acreage of urban land drains to this water-quality monitoring site?”
“How many miles of impaired streams are within this watershed?”
“How many bridge crossings are downstream from this location?”
High resolution elevation data—A LiDAR-derived elevation model was used to generate catchment boundaries for each stream reach and flow information for the entire basin. Catchments were assigned corresponding reach codes from the NHD.
Pre-computed values for selected watershed features—Acreages of land cover classes, slope classes, and impervious surface; numbers of potential contamination sources; and other land-based features have been computed for each catchment. These acreages can easily be aggregated upstream or downstream from a selected point on the NHD stream network.
All local jurisdictions, regional, State, and Federal interests in the Upper Neuse basin have access to the same data.
The UNRBA and NCEEP have used the WET to develop a management plan for Little Lick Creek, which the State of North Carolina has listed as “impaired” because the stream does not support healthy communities of fish and macroinvertebrates. The NCEEP, UNRBA, Durham City and County, and the North Carolina Division of Water Quality developed the management plan to address water-quality degradation and identify priorities for restoration and land protection.
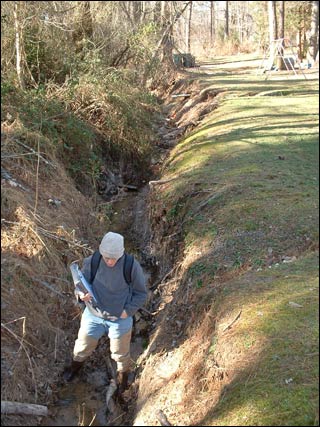
These agencies used the WET to delineate subwatersheds within the 21-square mile project area; conduct initial desktop analysis to support water-quality monitoring and field surveys (Figure 5); conduct assessments of land cover, impervious surfaces, current and future land use; and verify findings using aerial photography. The WET data were used for prioritizing lands critical for the protection of water quality and aquatic habitat in each subwatershed. Subwatershed maps and other information about the Little Lick Creek Local Watershed Plan can be obtained at http://www.unrba.org/littlelick/index.shtml.
Agencies are using the WET in a variety of applications and at various scales in the Upper Neuse River basin. For example, the UNRBA plans to develop a regional water-quality monitoring plan for the entire basin. Having digital access to stream maps, waterbody use-support ratings, land cover, locations of pollution sources, and historical monitoring results will help the UNRBA evaluate different monitoring sites and strategies. Local planners and utilities can use stream-network and related information to facilitate retrofitting pollution-control practices and developing plans for stormwater management and water- supply protection. The NCEEP can use information on hydrology, land cover, aerial photography, and watershed-delineation tools to streamline development of local watershed plans and to characterize potential mitigation sites.
By providing partners the same information with easy-to-use analytical tools, interagency cooperation is enhanced and encouraged. Planning is more integrated, and decisions can be based on local-level sources. Limited resources are optimized, and sound management of the Upper Neuse River basin is facilitated.
The WET was designed to answer typical planning and management questions. It simplifies tedious tasks, such as delineating drainage-area boundaries, summarizing watershed characteristics, identifying potential pollution sources, and finding features that lie upstream and(or) downstream from selected locations. The Upper Neuse WET serves as a model for applying the high-resolution NHD to meet local needs for managing watersheds.
Tetra Tech, Inc., 2003, Upper Neuse watershed management plan: Research Triangle Park, North Carolina, Tetra Tech, Inc., 70 p.
Author Link |
Silvia Terziotti U.S. Geological Survey 3916 Sunset Ridge Rd. Raleigh, NC 27607 (919) 571-4090 / Fax: (919) 571-4041 |
| seterzio@usgs.gov giorgino@usgs.gov dreps@tjcog.org |
Silvia Terziotti is a GIS Specialist with the U.S. Geological Survey North Carolina Water Science Center in Raleigh. She provides GIS support and technical guidance for hydrologic studies in North Carolina and on National USGS programs. Her current work includes deriving hydrologic features from LiDAR-derived Digital Elevation Models, using GIS Techniques to automate flood inundation models, and using the NHD to link multiple datasets for analysis.
| WET Data Layers | Indexed to NHD |
|---|---|
| Point Location Features | |
| NPDES sites | X |
| Landfills | |
| Hazardous-waste sites | X |
| Confined animal feeding operations | X |
| NCDWQ ambient water-quality monitoring sites | X |
| NCDWQ benthic macroinvertebrate monitoring sites | X |
| NCDWQ fish monitoring sites | X |
| Water-supply intakes | X |
| Durham water-quality sites | X |
| Raleigh water-quality sites | X |
| USGS streamgaging stations | X |
| USGS water-quality sites | X |
| Dams | |
| NCDOT bridges and culverts | |
Stream and Watershed Features |
|
| NCDWQ stream classifications | X |
| NCDWQ stream use-support ratings | X |
| Roads | |
| Elevation (LiDAR) | X |
| Catchment boundaries | X |
| Land cover | X |
| Catchment slope | X |
| Soils | |
| Natural Heritage sites | |
| Wetlands | |
| FEMA floodplain maps | |
Base Data Layers |
|
| Aerial photography | |
| Digital raster graphics | |
| Municipal boundaries | |
| 1:24,000 National Hydrography Dataset |

Figure 1. Hotlinks to web-accessible data sources are incorporated into key layers.

Figure 2. Catchments, derived from a LiDAR-elevation source, are delineated around every NHD stream reach.

Figure 3. As stream traces are performed, data layers that are indexed to the NHD are selected. In this example, City of Durham monitoring sites (squares), NPDES sites (circles), and North Carolina Division of Water Quality stream classifications that are indexed to the selected stream reaches are automatically selected and displayed.

Figure 4. The WET generates statistics for a watershed by aggregating data from all upstream reaches or catchments. In this example, statistics for acreage of urban land are presented for the selected area.

Figure 5. Field work for the Little Lick Creek Local Watershed Plan was facilitated by using the WET to analyze and preselect areas for study (photo courtesy of UNRBA).